Mixer Introduction
Theory of Operation
This is the "Quadrature Sampling Detector" (QSD) stage of the radio. The filtered RF from the BPF stage is clocked through the mixer against the two quadrature signals from the divider stage. The output of the mixer is two audio frequency signals representing the difference between the incoming RF and the clocking signals.
In the most of the kits, the clocking signals are at the desired center frequency. In the 20m and 15m kits, the clocking signals are at one-third of the desired center frequency. With the incoming RF having been filtered to reject out-of-band signals, the RF in the pass-band reacts to and is sampled against the third harmonic of the clocking signals, resulting in audio frequency outputs that represent the difference between the third harmonic (which is the desired center frequency) and the filtered, incoming RF. This technique is called "1/3 sub harmonic sampling". It causes us to need a higher gain opamp stage in the kits using this feature. In addition, because of the odd harmonic sampling, the I and Q signals are reversed, necessitating a reversal of the I and Q connections in the final stage.
(go directly to build notes)Mixer Schematic
(Resistor testpoints (hairpin, top, or left-hand lead), as physically installed on the board, are marked in the schematic with red dots)
(Click for Full Schematic)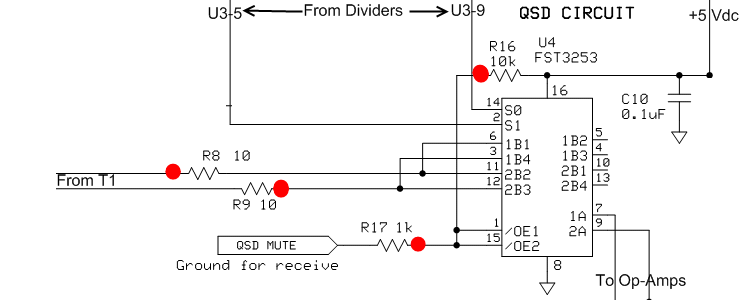
(go directly to build notes)
Mixer Bill of Materials
Stage Bill of Materials
(resistor images and color codes courtesy of WIlfried, DL5SWB's R-Color Code program)
| Check | Designation | Component | Marking | Category | Orientation | Notes | Circuit |
|---|---|---|---|---|---|---|---|
| ❏ | U4 | FST3253 mux/demux switch | FST3253
 | SOIC-16 | Mixer | ||
| ❏ | C10 | 0.1 uF | (smt) black stripe
 | SMT 1206 | Mixer | ||
| ❏ | R08 | 10 ohm 1/4W 1% | br-blk-blk-gld-br
 | 1/4W | W-E | Mixer | |
| ❏ | R09 | 10 ohm 1/4W 1% | br-blk-blk-gld-br
 | 1/4W | S-N | Mixer | |
| ❏ | R16 | 10 k 1/4W 1% | br-blk-blk-r-br
 | 1/4W | E-W | Mixer | |
| ❏ | R17 | 1 k 1/4W 1% | br-blk-blk-br-br
 | 1/4W | E-W | Mixer |
Mixer Summary Build Notes
- Install U4
- Install SMT Cap
- Install Resistors
- Test the Stage
Mixer Detailed Build Notes
Bottom of the Board
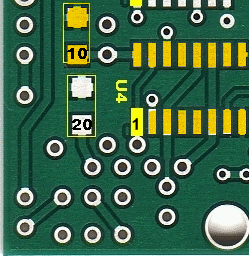
Install U4
| Check | Designation | Component | Marking | Category | Orientation | Notes |
|---|---|---|---|---|---|---|
| ❏ | U4 | FST3253 mux/demux switch | FST3253
 | SOIC-16 | Take ESD precautions |
Install SMT Cap
| Check | Designation | Component | Marking | Category | Orientation | Notes |
|---|---|---|---|---|---|---|
| ❏ | C10 | 0.1 uF | (smt) black stripe
 | SMT 1206 |
Top of the Board

Install Resistors
| Check | Designation | Component | Marking | Category | Orientation | Notes |
|---|---|---|---|---|---|---|
| ❏ | R08 | 10 ohm 1/4W 1% | br-blk-blk-gld-br
 | 1/4W | W-E | |
| ❏ | R09 | 10 ohm 1/4W 1% | br-blk-blk-gld-br
 | 1/4W | S-N | |
| ❏ | R16 | 10 k 1/4W 1% | br-blk-blk-r-br
 | 1/4W | E-W | |
| ❏ | R17 | 1 k 1/4W 1% | br-blk-blk-br-br
 | 1/4W | E-W |
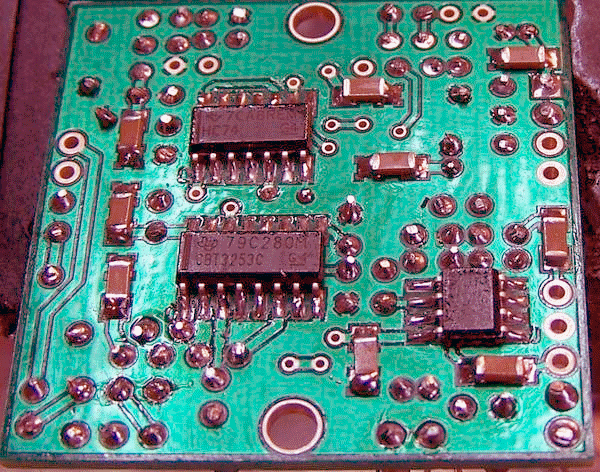
Mixer Completed Stage
Top of the Board
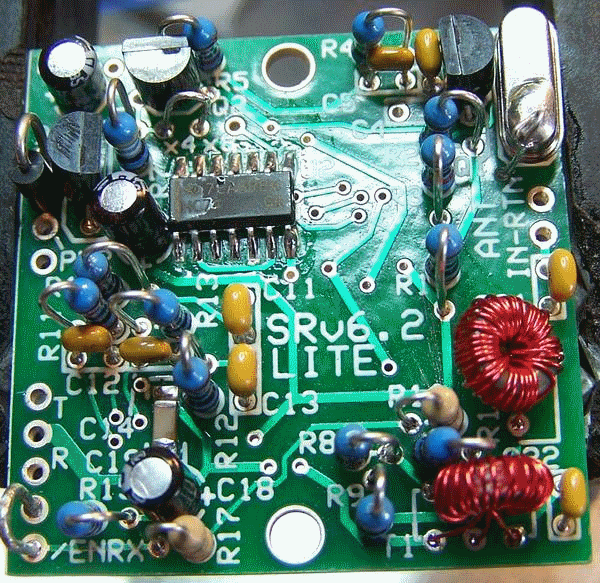
Bottom of the Board
Mixer Testing
ESD
Test Setup
Take appropriate ESD precautions in these tests, since you will be working around the very sensitive mixer IC
Visual Inspection
Test Setup
Using very good lighting and magnification, carefully inspect the solder joints to identify bridges, cold joints, or poor contacts.
Pay especial attention to the joints on the Mixer IC pins. If necessary, touch up the joints with your iron and/or some flux. Wick up any excess.
Resistance Measurements
Test Setup
With power OFF, measure the resistance WRT (with respect to) ground at each of the secondary leads of T1 (see graphic below).

Test Measurements
| Testpoint | Units | Nominal Value | Author's | Yours |
|---|---|---|---|---|
| Point 1 to ground | ohm | 700 - 800 | 790 | _______ |
| Point 2 to ground | ohm | 700 - 800 | 790 | _______ |
| Point 3 to ground | ohm | 700 - 800 | 790 | _______ |
| Point 4 to ground | ohm | 700 - 800 | 790 | _______ |
Current Draw
Test Setup
- connect a 1k ohm resistor in series with the positive power lead
- apply 9 Vdc and measure the current draw with the limiting resistor in place
- remove the current limiting resistor
- apply 9 Vdc and measure the current draw without the limiting resistor
Test Measurements
| Testpoint | Units | Nominal Value | Author's | Yours |
|---|---|---|---|---|
| Current draw WITH 1k ohm current limiting resistor | mA | < 9 | 6.2 | _______ |
| Current draw without the limiting resistor | mA | 25 - 35 | 30.8 | _______ |
U4 pin voltages
Test Setup
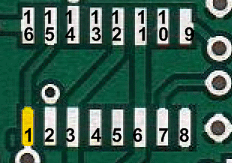
Power up the board and measure the pin voltages (on the pins, not the pads) of U4, per the table below
Make sure you have enabled the shunt wire between the "/ENRX" terminal and ground, as directed in the Power Supply Stage. If that has not been done, you will get incorrect voltages in the Pin1/Pin15 test and the mixer will not work.
Test Measurements
| Testpoint | Units | Nominal Value | Author's | Yours |
|---|---|---|---|---|
| Pin 14 (S0) | Vdc | 2.3 - 2.4 | 2.29 | _______ |
| Pin 2 (S1) | Vdc | 2.3 - 2.4 | 2.31 | _______ |
| Pin3 & 12 | Vdc | 2.3 - 2.4 | 2.34 | _______ |
| Pin 6 & 11 | Vdc | 2.3 - 2.4 | 2.34 | _______ |
| Pin 7 (1A) | Vdc | 2.3 - 2.4 | 2.34 | _______ |
| Pin 9 (2A) | Vdc | 2.3 - 2.4 | 2.34 | _______ |
| Pin 16 (Vcc) | Vdc | 5 | 4.94 | _______ |
| Pin 8 (gnd) | Vdc | 0 | 0 | _______ |
| Pins 1 and 15 | mVdc | 400-500 | 450 | _______ |
Mixer Output - Scope Test
Test Setup
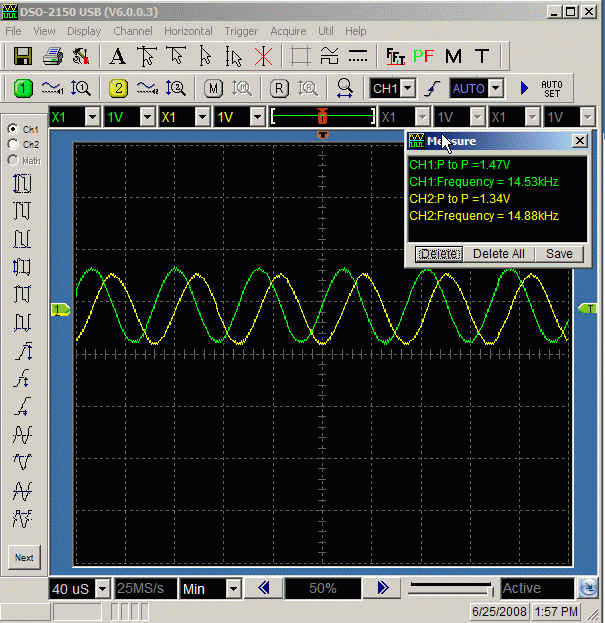
The 40m SoftRock Lite voltage gain from RF volts in to I or Q volts out should be about 11. Thus a 50 mV RMS RF input should give a p-p audio volts output on the I and Q outputs of about 1.6 volts.
- Inject an RF input frequency of 7.042 MHz at 50 mv amplitude. This level makes it easier to look at with a scope and it's not overloading our board. With a center frequency of 7.056 MHz, this should cause a 14 kHz audio frequency at the tip/ring outputs of the board.
- Connect a scopeís probes to the ring and to the tip pads on the board and setup the scope for X-Y view, triggering on Channel 1.
- Measure the frequency and p-p voltage. With a 50mV p-p input RF signal you should see a 1.6 V p-p output at an audio frequency that is equal to the difference between the RF frequency and the LO Center frequency.
- The signals at the ring and tip outputs should be 90 degrees out of phase with one another.
- The image below shows the waveform that results from feeding a 50 mV 7/042 MHz signal into the receiverís antenna terminals.
- The I / Q outputs should be clean sine waves if the RF input is not too high. The frequency of the sine waves should be the difference between the center frequency of the SoftRock and the RF input frequency. Phase relationship between the two sine waves, which one is leading, depends on if the RF input is above or below the SoftRock center frequency.
